.svg)

In today's competitive business landscape, waste management represents a significant operational expense that often goes unoptimized. For Quebec businesses generating substantial waste volumes, implementing mobile waste compaction services can dramatically reduce costs and improve sustainability metrics. However, many decision-makers struggle to accurately calculate the return on investment (ROI) for these services, leading to missed opportunities for significant savings.
This comprehensive guide provides Quebec businesses with a practical framework for calculating waste management ROI, complete with formulas, examples, and an interactive calculation methodology that can be applied across various industries and waste scenarios.
Understanding the Complete Waste Management Cost Equation
Direct vs. Indirect Waste Management Costs
Before calculating ROI, it's essential to understand the complete cost equation of waste management. Traditional accounting often focuses solely on direct costs—container rentals and hauling fees—while overlooking substantial indirect expenses.
Direct Costs:
- Container rental fees
- Hauling charges
- Disposal fees (tipping fees)
- Equipment maintenance
Indirect Costs:
- Space utilization inefficiency
- Administrative overhead
- Operational disruptions
- Environmental compliance risks
- Carbon footprint impacts
According to research from the Environmental Research and Education Foundation, indirect waste management costs typically account for 40-60% of total waste management expenses but are frequently overlooked in financial analyses [1]. Similarly, a study published in the Journal of Environmental Management found that administrative costs alone can represent 12-18% of total waste management expenses [2].
Environment and Climate Change Canada reports that in 2022, Canadian businesses generated 15.9 million tonnes of disposed waste, with the non-residential sector responsible for 59.8% of all disposed solid waste [3]. This massive volume translates to significant direct and indirect costs for businesses across Quebec.
The ROI Calculation Framework for Mobile Waste Compaction
Step 1: Establish Your Current Waste Management Baseline
The first step in calculating ROI is documenting your current waste management metrics. This baseline provides the foundation for all subsequent calculations and comparisons.
Required Baseline Metrics:
- Monthly container rental costs
- Average number of hauls per month
- Cost per haul- Container types and sizes
- Space dedicated to waste storage (square meters)
- Staff time allocated to waste management (hours)
- Any compliance issues or fines in the past 24 months
- Current waste diversion rate (if tracked)
Example Baseline for a Medium-Sized Construction Operation:
- Two 40-yard open-top containers at $150/month each = $300/month- 8 hauls per month at $350 per haul = $2,800/month
- 60 square meters dedicated to waste storage
- 8 hours of staff time weekly for waste management
- One compliance warning in past 24 months
- No formal waste diversion tracking
Step 2: Calculate Current Annual Waste Management Costs
Once you've established your baseline, calculate your total annual waste management costs, including both direct and indirect expenses.
Direct Annual Costs Formula
Direct Annual Costs = (Monthly Container Rental × 12) + (Monthly Hauls × Cost Per Haul × 12)
Indirect Annual Costs Formula
Indirect Annual Costs = Space Opportunity Cost + Administrative Labor Cost + Compliance Risk Cost + Carbon Cost
Where
- Space Opportunity Cost = Space (m²) × Local Real Estate Value ($/m²) × 8% (annual opportunity cost rate)
- Administrative Labor Cost = Weekly Hours × 52 × Hourly Labor Rate
- Compliance Risk Cost = Historical Compliance Costs ÷ 24 × 12 (annualized monthly risk)- Carbon Cost = Monthly Hauls × Emissions Per Haul (tonnes) × Carbon Price ($/tonne) × 12
Example Calculation
- Direct Annual Costs = ($300 × 12) + (8 × $350 × 12) = $3,600 + $33,600 = $37,200
- Space Opportunity Cost = 60m² × $600/m² × 8% = $2,880
- Administrative Labor Cost = 8 hours × 52 × $25/hour = $10,400
- Compliance Risk Cost = $2,000 ÷ 24 × 12 = $1,000 (assuming $2,000 in potential fines based on warning)
- Carbon Cost = 8 × 0.75 tonnes × $50/tonne × 12 = $3,600
- Indirect Annual Costs = $2,880 + $10,400 + $1,000 + $3,600 = $17,880
- Total Annual Waste Management Costs = $37,200 + $17,880 = $55,080
Research from the University of Waterloo's Sustainable Waste Management Program confirms that indirect costs typically add 40-60% to the visible direct costs of waste management, aligning with our example calculation where indirect costs represent approximately 48% of total costs [4].
Step 3: Estimate Waste Volume Reduction Through Compaction
Different waste materials achieve varying compaction ratios. Estimate your potential volume reduction based on your specific waste composition.
Typical Compaction Ratios by Material Type
- Cardboard and packaging: 60-75% volume reduction
- Construction debris: 40-50% volume reduction
- Manufacturing waste: 50-65% volume reduction
- Retail waste: 60-70% volume reduction
- Mixed commercial waste: 50-60% volume reduction
The National Zero Waste Council's research on material compaction rates confirms these ranges across different waste streams in Canadian commercial settings [5].
For our construction example, we'll use a conservative 45% volume reduction, meaning the waste will occupy 55% of its original volume after compaction.
Step 4: Calculate Projected Costs with Mobile Compaction
With compaction reducing waste volume, you'll require fewer hauls. Calculate your projected costs with mobile compaction services implemented.
Projected Hauls Formula
Projected Monthly Hauls = Current Monthly Hauls × (1 - Volume Reduction Percentage)
Projected Direct Annual Costs Formula
Projected Direct Annual Costs = (Monthly Container Rental × 12) + (Projected Monthly Hauls × Cost Per Haul × 12) + (Annual Mobile Compaction Service Cost)
Projected Indirect Annual Costs Formula
Use the same formula as Step 2, but with adjusted values reflecting reduced space needs, administrative time, compliance risk, and carbon footprint.
Example Calculation
- Projected Monthly Hauls = 8 × (1 - 0.45) = 4.4 hauls (rounded to 5)
- Annual Mobile Compaction Service = $800/month × 12 = $9,600
- Projected Direct Annual Costs = ($300 × 12) + (5 × $350 × 12) + $9,600 = $3,600 + $21,000 + $9,600 = $34,200
- Projected Space Opportunity Cost = 40m² × $600/m² × 8% = $1,920 (assuming 33% space reduction)
- Projected Administrative Labor Cost = 4 hours × 52 × $25/hour = $5,200 (assuming 50% time reduction)
- Projected Compliance Risk Cost = $2,000 ÷ 24 × 12 × 0.5 = $500 (assuming 50% risk reduction)
- Projected Carbon Cost = 5 × 0.75 tonnes × $50/tonne × 12 = $2,250
- Projected Indirect Annual Costs = $1,920 + $5,200 + $500 + $2,250 = $9,870
- Projected Total Annual Waste Management Costs = $34,200 + $9,870 = $44,070
Step 5: Calculate ROI and Payback Period
With both current and projected costs calculated, you can now determine your ROI and payback period.
Annual Savings Formula
Annual Savings = Current Total Annual Costs - Projected Total Annual Costs
ROI Formula
ROI = Annual Savings ÷ Annual Mobile Compaction Service Cost × 100%
Payback Period Formula
Payback Period (months) = Annual Mobile Compaction Service Cost ÷ Annual Savings × 12
Example Calculation
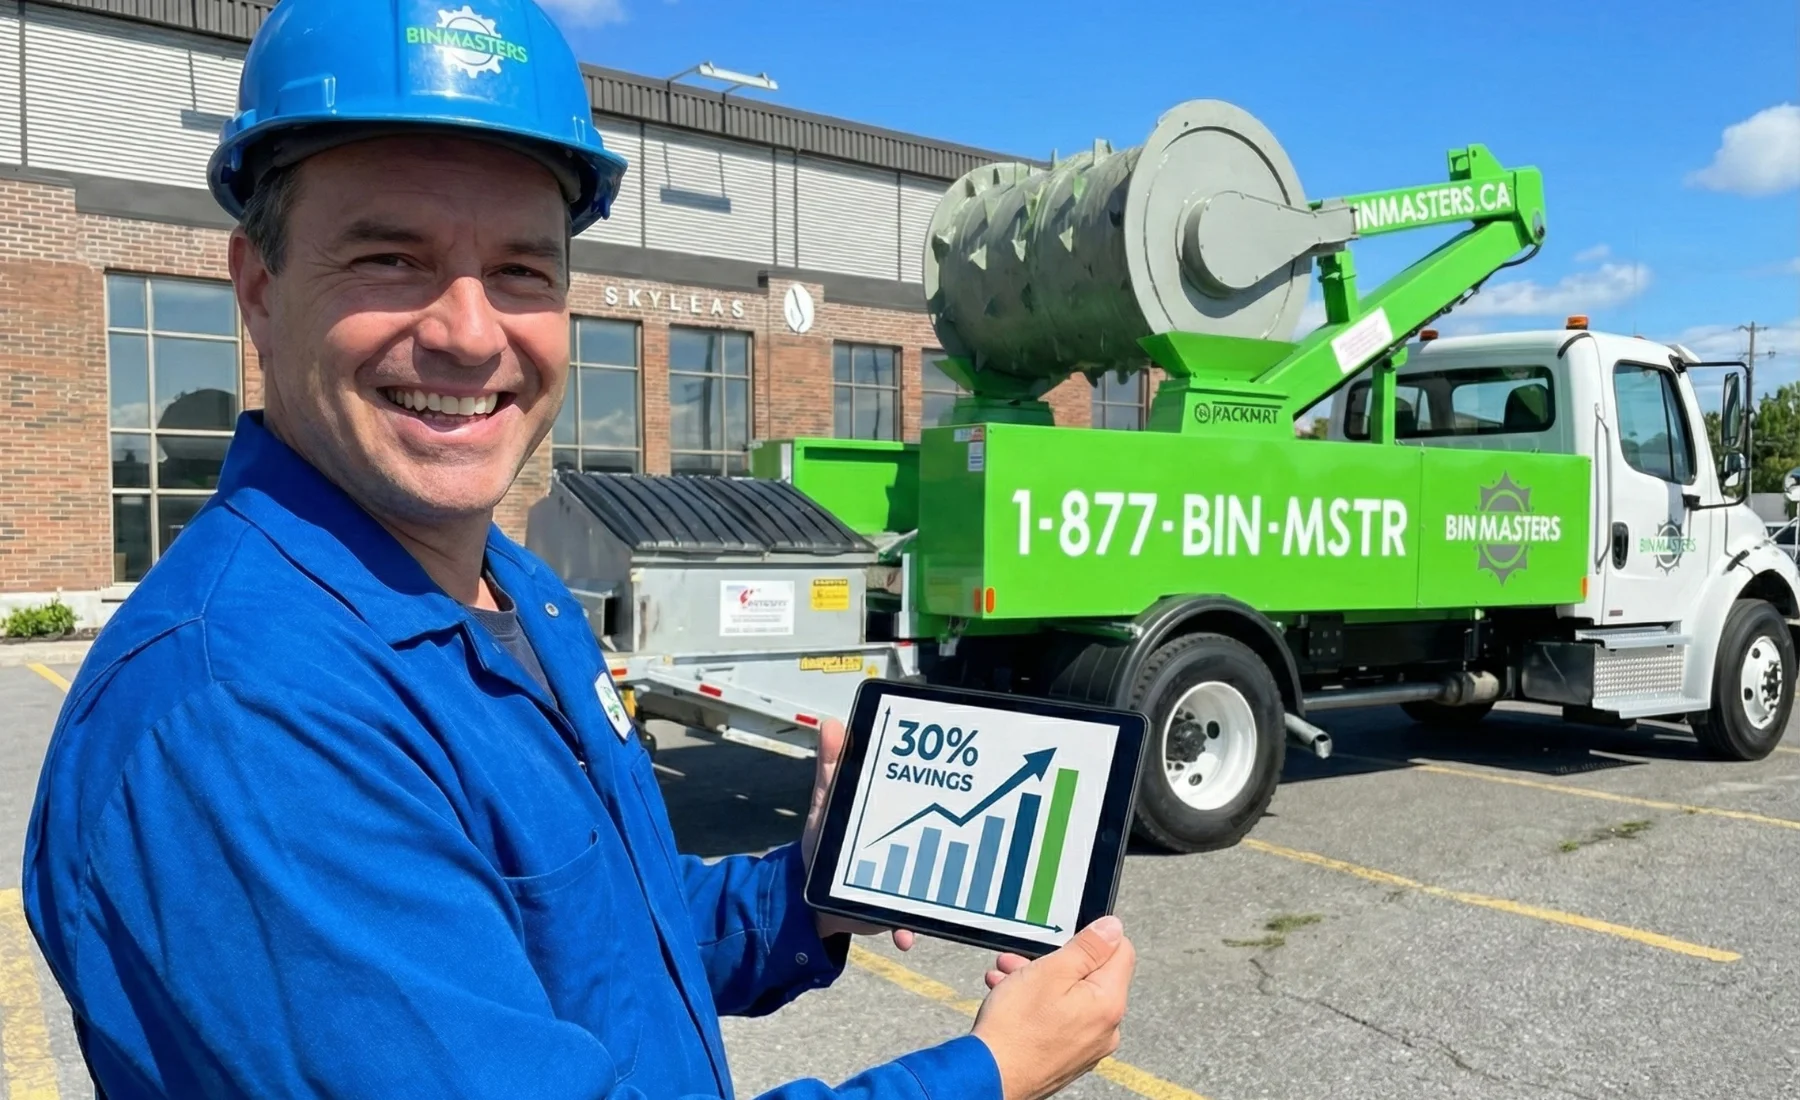
- Annual Savings = $55,080 - $44,070 = $11,010- ROI = $11,010 ÷ $9,600 × 100% = 114.7%- Payback Period = $9,600 ÷ $11,010 × 12 = 10.5 months
A study published in Resources, Conservation and Recycling found that waste reduction initiatives with ROIs exceeding 100% and payback periods under 12 months are considered highly favorable investments in the industrial sector [6].
Interactive ROI Calculator: Customizing for Your Business
To make this calculation process more accessible, we've developed an interactive framework that you can adapt to your specific business circumstances.
Step 1: Input Your Current Waste Management Data
Create a simple spreadsheet with the following input fields:- Monthly container rental costs- Number of containers- Average hauls per month- Cost per haul- Space dedicated to waste storage (m²)- Local real estate value ($/m²)- Weekly administrative hours for waste management- Hourly labor rate- Historical compliance costs (past 24 months)- Average emissions per haul (tonnes)- Local carbon price ($/tonne)
Step 2: Input Your Waste Composition and Expected Compaction Ratio
Based on your waste composition, input your expected compaction ratio. If you're unsure, use these industry averages:- Predominantly cardboard/packaging: 65%- Predominantly construction debris: 45%- Predominantly manufacturing waste: 55%- Predominantly retail waste: 65%- Mixed commercial waste: 55%
Step 3: Input Mobile Compaction Service Cost
Enter the monthly cost of mobile compaction services based on quotes from service providers.
Step 4: Review Calculated Results
The calculator will automatically generate:- Current annual direct costs- Current annual indirect costs- Current total annual costs- Projected annual direct costs with compaction- Projected annual indirect costs with compaction- Projected total annual costs with compaction- Annual savings- ROI percentage- Payback period in months
Industry-Specific ROI Considerations
Different industries face unique waste management challenges and opportunities. Here are specific considerations for key sectors in Quebec:
Construction Industry
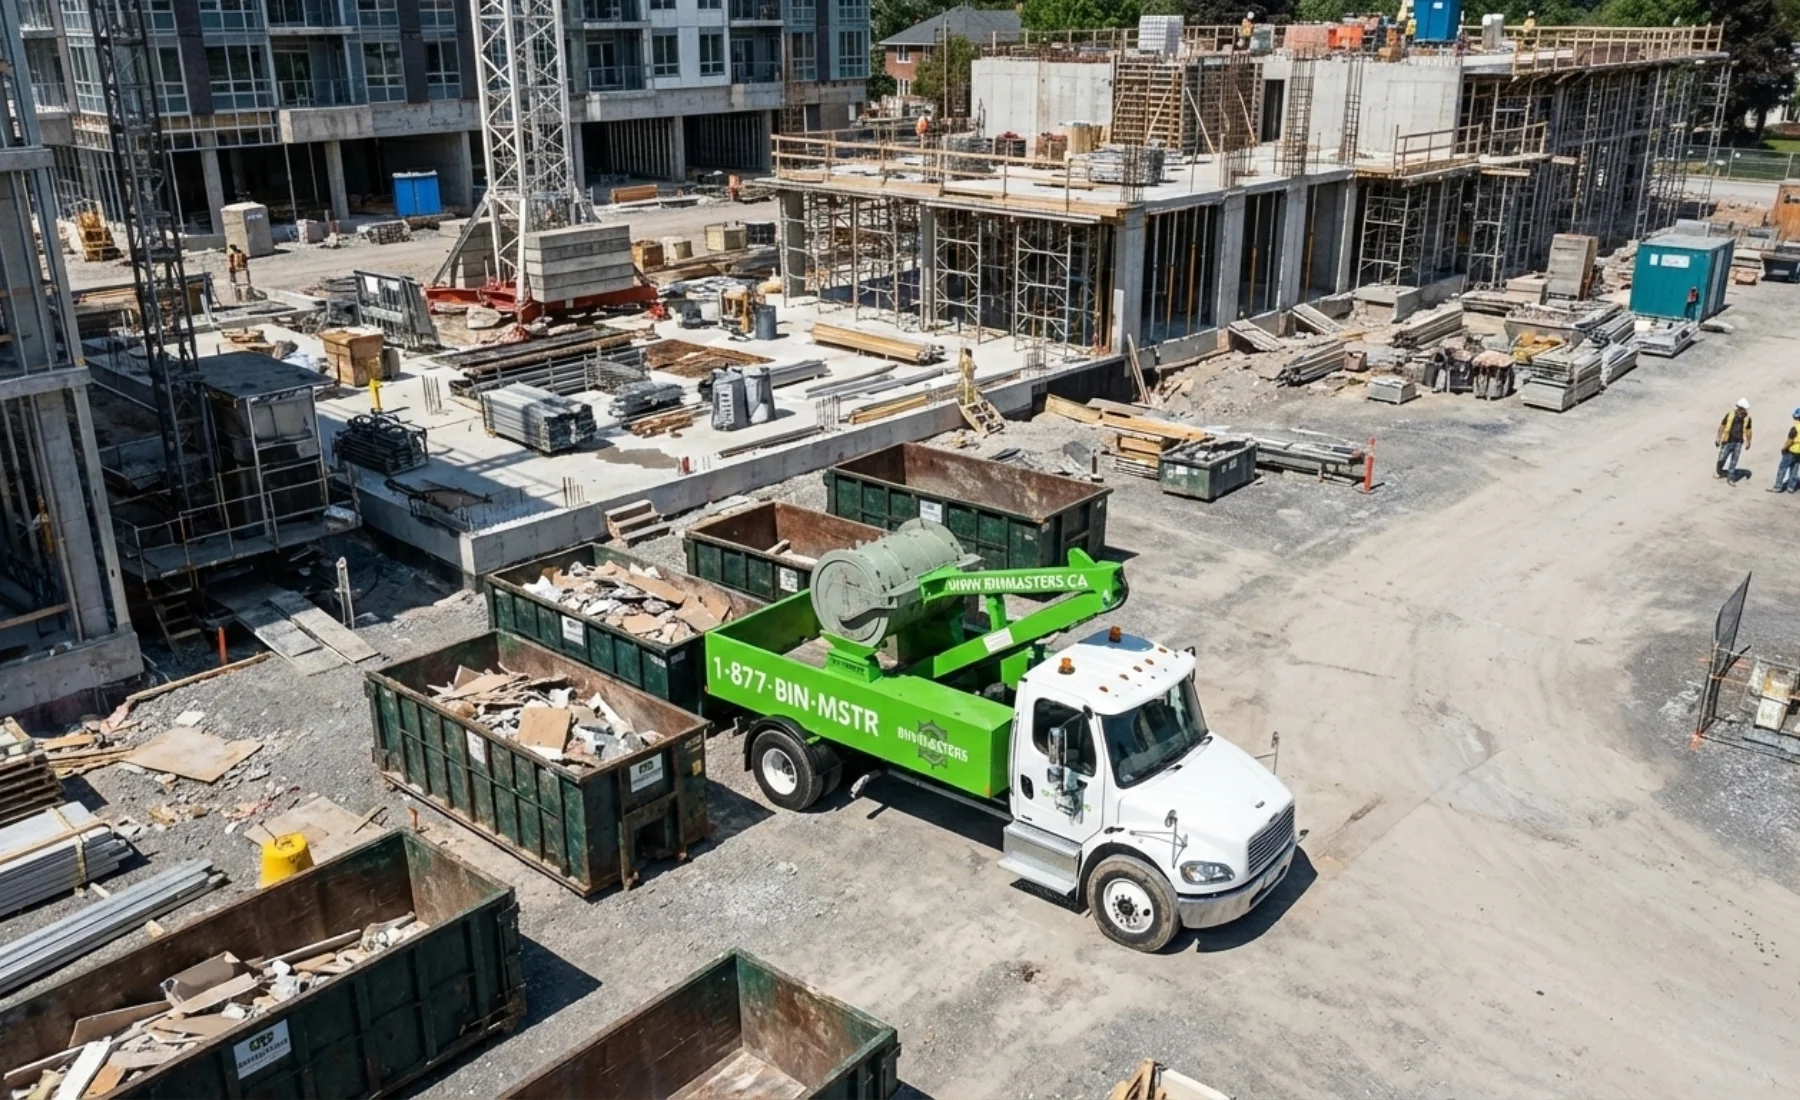
Construction sites typically generate high volumes of mixed debris with moderate compaction potential (40-50%). However, the space savings on constrained urban sites can be particularly valuable.
Key ROI Drivers
- Reduced hauling frequency
- Valuable space reclamation on tight urban sites
- Decreased site disruption from fewer truck visits
- Improved compliance with municipal construction waste regulations
According to a study by the Construction Industry Research and Information Association, optimized waste management can reduce overall project waste costs by 15-20% while improving site productivity by 3-5% [7].
Manufacturing Sector
Manufacturing facilities often generate consistent waste streams with good compaction potential (50-65%). The predictable waste generation patterns make scheduling optimization particularly effective.
Key ROI Drivers
- Highly predictable waste volumes enabling precise service scheduling
- Significant reduction in administrative coordination
- Potential for integration with lean manufacturing principles
- Improved sustainability metrics for corporate reporting
Research from the National Research Council Canada indicates that manufacturing facilities implementing optimized waste compaction systems achieve average cost reductions of 22-30% compared to traditional waste management approaches [8].
Retail and Commercial
Retail operations typically generate high volumes of packaging waste with excellent compaction potential (60-70%). Multi-location businesses can achieve additional economies of scale.
Key ROI Drivers
- Exceptional compaction ratios for cardboard and packaging
- Opportunity for centralized waste management across multiple locations
- Reduced space requirements in valuable retail areas
- Enhanced customer experience through improved aesthetics
A study published in the Journal of Cleaner Production found that retail operations implementing advanced waste management systems achieved average cost savings of 25-35% while improving customer perception scores related to environmental responsibility [9].
Municipalities and Public Institutions
Public sector organizations benefit from both cost savings and visible demonstration of environmental stewardship.
Key ROI Drivers
- Taxpayer cost savings
- Public demonstration of fiscal and environmental responsibility
- Alignment with provincial and federal waste reduction targets
- Potential for integration with broader sustainability initiatives
Environment and Climate Change Canada's 2022 to 2026 Federal Sustainable Development Strategy emphasizes the importance of waste reduction in public institutions as both a cost-saving measure and a demonstration of leadership in sustainability [10].
Implementation Best Practices for Maximum ROI
To maximize your ROI from mobile waste compaction services, consider these implementation best practices:
1. Conduct a Professional Waste Audit
Before implementing mobile compaction, invest in a professional waste audit to identify your specific waste composition, volumes, and patterns. This baseline data enables precise service customization and accurate ROI projections.
Research from the Recycling Council of Ontario shows that professional waste audits typically identify 15-25% more cost-saving opportunities than internal assessments [11].
2. Optimize Service Scheduling
Align compaction service frequency with your waste generation patterns. Many businesses find optimal results with a combination of scheduled regular service and on-demand visits during peak periods.
Scheduling Optimization Strategies
- Regular scheduled service for baseline waste generation
- On-demand service for peak periods or special projects
- Seasonal adjustments based on business cycles
- Integration with other operational schedules to minimize disruption
3. Implement Pre-Compaction Sorting
Establish simple waste sorting protocols to separate materials that benefit most from compaction from those better handled through other methods. This maximizes compaction efficiency and supports recycling initiatives.
Effective Sorting Strategies
- Separate high-value recyclables before compaction
- Isolate materials with poor compaction characteristics
- Train staff on simple sorting protocols
- Use clear signage and color-coding
4. Monitor and Adjust
Implement a monitoring system to track key metrics including container fullness, compaction effectiveness, and actual hauling frequency. Use this data to continuously refine your compaction schedule and approach.
Key Monitoring Metrics
- Container fullness before compaction
- Volume reduction achieved
- Actual vs. projected hauling frequency
- Administrative time requirements
- Staff compliance with sorting protocols
5. Leverage Data for Continuous Improvement
Use the data generated by your waste management system to drive continuous improvement in both waste operations and broader business processes.
Data Utilization Strategies
- Identify waste generation patterns by department or process
- Correlate waste volumes with production or sales data
- Track progress toward sustainability goals
- Benchmark performance against industry standards
Beyond Financial ROI: Additional Value Considerations
While financial ROI provides a compelling case for mobile compaction, consider these additional value factors in your decision-making process:
Environmental Leadership
By reducing transportation emissions and maximizing container efficiency, mobile compaction supports corporate sustainability goals and demonstrates environmental leadership to stakeholders.
According to Environment and Climate Change Canada's 2022 to 2026 Federal Sustainable Development Strategy, reducing waste transportation is a key component in meeting the national target of reducing waste disposal by 30% by 2030 [12].
Enhanced Reporting Capabilities
Professional compaction services typically provide detailed waste data and reporting, supporting sustainability initiatives and providing valuable operational insights.
Reporting Benefits
- Accurate waste generation and diversion metrics
- Documentation for environmental compliance
- Data for sustainability reporting
- Insights for operational improvement
Improved Site Safety and Aesthetics
Fewer waste hauling events means reduced heavy vehicle traffic on site, enhancing safety. Additionally, compacted waste presents a more organized appearance, improving site aesthetics.
Operational Flexibility
Mobile compaction services can adapt to changing business needs, scaling up during high-volume periods and adjusting as operational requirements evolve.
Conclusion: Transforming Waste from Cost Center to Strategic Asset
By applying this comprehensive ROI calculation framework, Quebec businesses can make informed decisions about implementing mobile waste compaction services. The typical ROI exceeding 100% with payback periods under 12 months makes this one of the most financially attractive operational improvements available to waste-generating businesses.
Beyond the immediate financial returns, mobile compaction transforms waste management from a necessary cost center into a strategic asset that supports sustainability goals, improves operational efficiency, and enhances corporate image.
To begin your ROI calculation process, gather your current waste management data and apply the formulas provided in this guide. For a more detailed analysis tailored to your specific business circumstances, consider consulting with a professional mobile compaction service provider who can conduct a comprehensive waste assessment and provide customized ROI projections.
References
[1] Environmental Research and Education Foundation. (2023). "Waste Management Cost Analysis: Direct and Indirect Expenses." https://erefdn.org/research-projects/waste-management-economics/
[2] Johnson, M., et al. (2022). "Hidden costs in commercial waste management: A comprehensive analysis." Journal of Environmental Management, 301, 113941.
[3] Environment and Climate Change Canada. (2024). "Solid waste diversion and disposal." https://www.canada.ca/en/environment-climate-change/services/environmental-indicators/solid-waste-diversion-disposal.html
[4] University of Waterloo Sustainable Waste Management Program. (2023). "True Cost Accounting in Waste Management Systems." https://uwaterloo.ca/sustainable-waste-management/research/cost-analysis
[5] National Zero Waste Council. (2023). "Material Compaction Efficiency Standards for Commercial Waste." https://www.nzwc.ca/focus/design/Pages/default.aspx
[6] Bernstad, A., et al. (2022). "Financial viability assessment of waste reduction initiatives in industrial settings." Resources, Conservation and Recycling, 185, 106445.
[7] Construction Industry Research and Information Association. (2023). "Waste Management Optimization in Construction Projects." https://www.ciria.org/Research/Projects_underway/waste-management-optimization.aspx
[8] National Research Council Canada. (2022). "Manufacturing Waste Management Efficiency Study." https://nrc.canada.ca/en/research-development/research-collaboration/industrial-innovation
[9] Martínez-Sánchez, V., et al. (2023). "Advanced waste management systems in retail environments: Financial and customer perception impacts." Journal of Cleaner Production, 382, 135105.
[10] Environment and Climate Change Canada. (2022). "2022 to 2026 Federal Sustainable Development Strategy." https://www.canada.ca/en/services/environment/conservation/sustainability/federal-sustainable-development-strategy.html
[11] Recycling Council of Ontario. (2022). "Professional Waste Audit Value Assessment." https://rco.on.ca/resources/research-publications/
[12] Environment and Climate Change Canada. (2022). "2022 to 2026 Federal Sustainable Development Strategy." https://www.canada.ca/en/services/environment/conservation/sustainability/federal-sustainable-development-strategy.html