.svg)

When it comes to controlling operational costs and environmental footprints, few areas offer more opportunity than waste management. But tossing garbage in the bin is no longer enough, efficient businesses and municipalities are taking a step back and asking: how does waste actually flow through our facilities, and how can we pinpoint waste journey points to optimize every step? That’s where waste journey mapping shines. By mapping waste from generation all the way to on-site compaction, we unlock actionable insights to boost process optimization, workflow efficiency, and sustainable savings.
Why Map the Waste Journey, And Why Now?
- Pays Immediate Dividends: Waste journey mapping identifies hidden costs, like unnecessary container pickups, non-optimized workflows, or wasted bin space, leading directly to cost reductions.
- Enables Process Improvement: Businesses and municipalities who map their waste find streamlined processes, from smarter material segregation to better compactor utilization.
- Drives Sustainable Results: By reducing transportation and optimizing collections, greenhouse gas emissions are mitigated, supporting both regulatory and climate objectives.
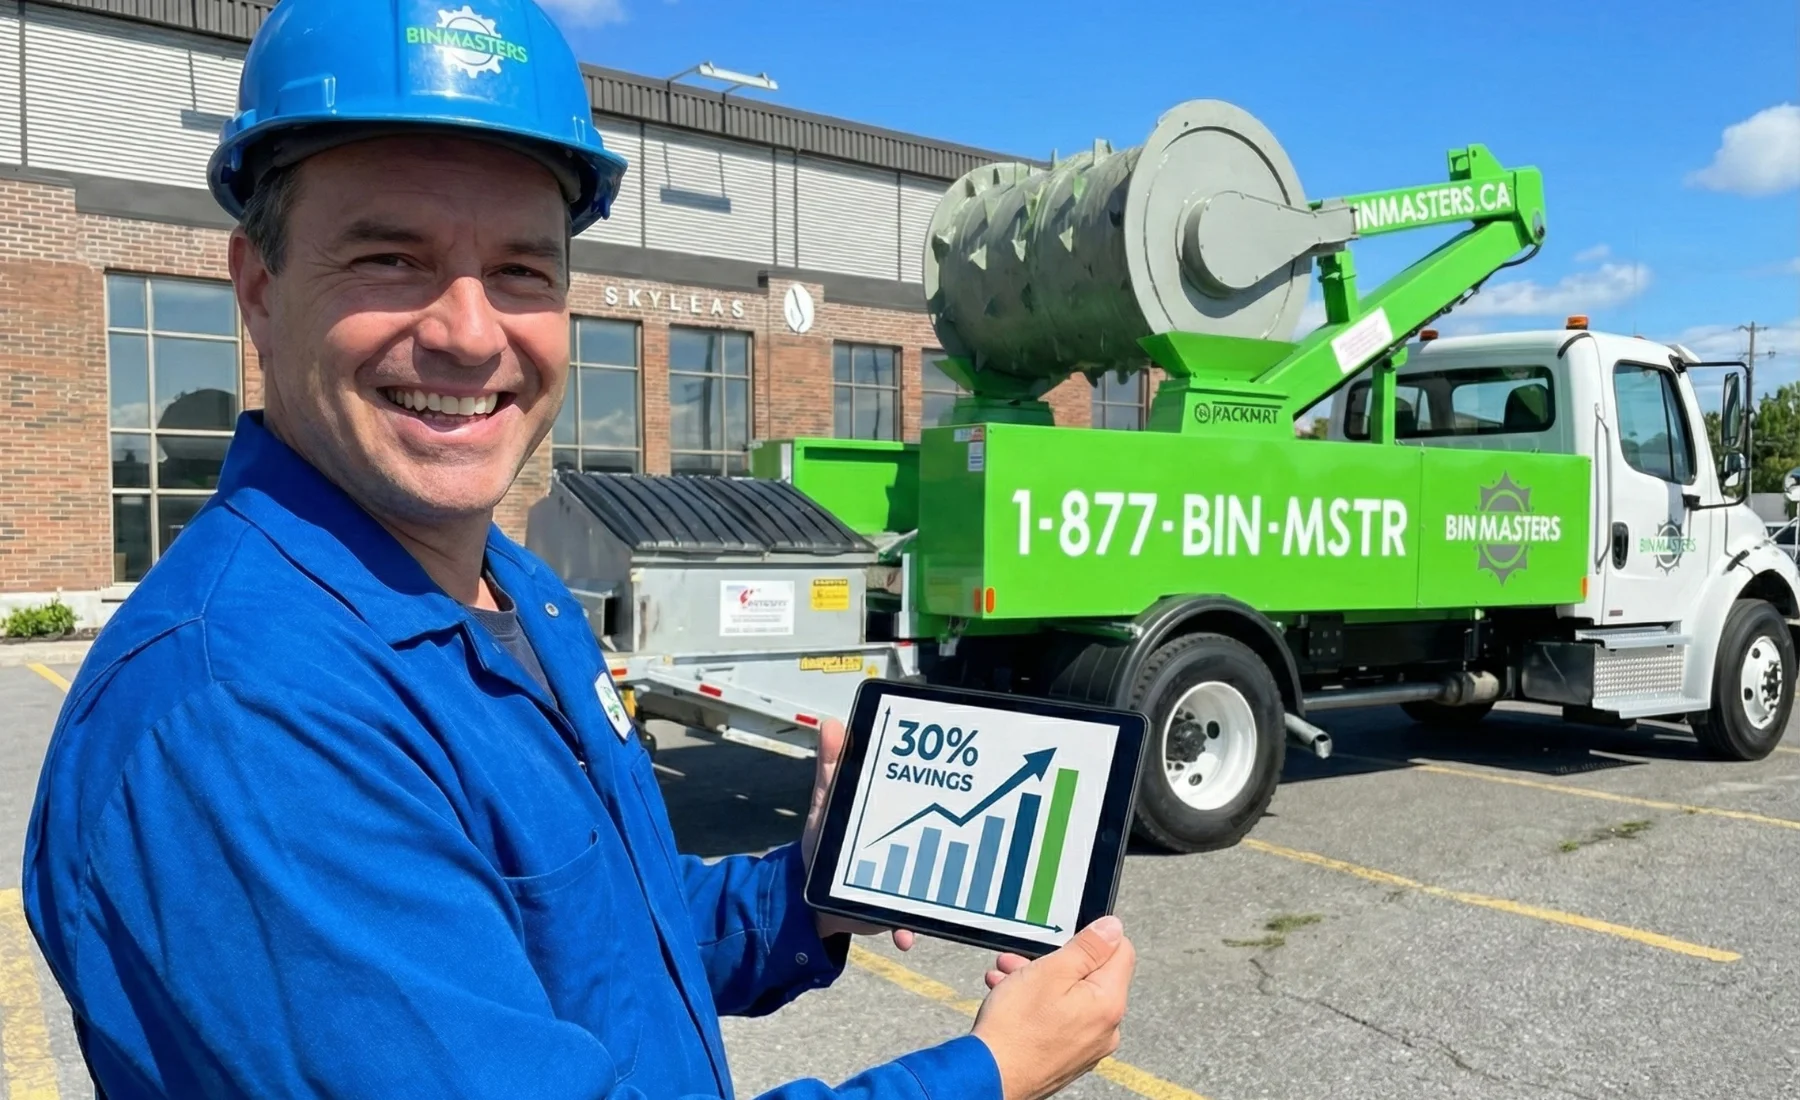
We've seen Quebec organizations cut waste collection costs by 40–70% simply by understanding and re-engineering their journey from point of waste generation to on-site compaction, without purchasing new equipment or making sweeping operational changes.
Step 1: Build a Cross-Functional Team
Waste is not just an operations issue, it's tied to finance, ESG, and logistical priorities. Start by gathering this core group:
- Operations Managers/Site Supervisors – Know the boots-on-the-ground workflow.
- Environmental Coordinators – Bring a sustainability and compliance focus.
- Facilities and Maintenance Staff – Understand daily waste generation points.
- Finance or Budget Owners – Monitor direct and indirect costs.
Each stakeholder offers a unique window into current practices and future goals. Don’t skip this step, true process optimization demands buy-in from all angles.
Step 2: Map Every Waste Generation Point
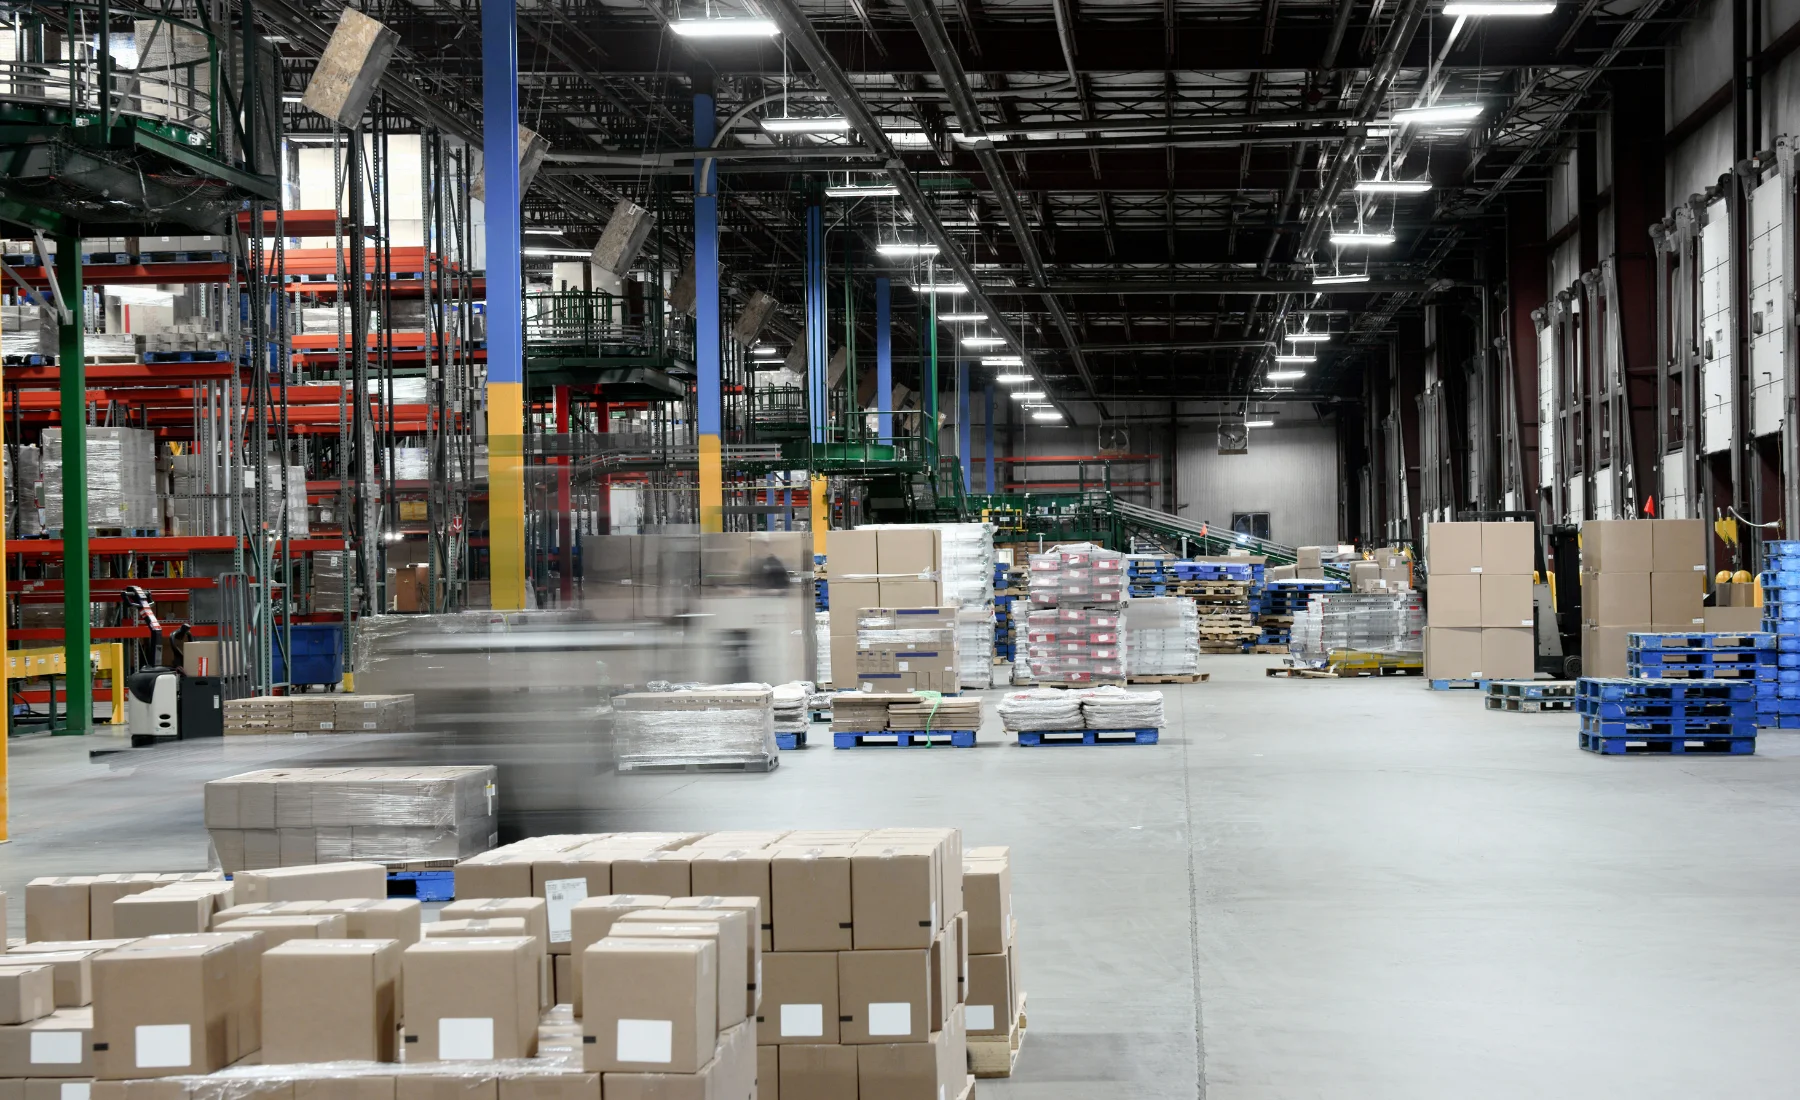
Walk through your site, whether it’s a construction yard in Laval, a retail warehouse in Montreal, or a multi-unit residential building. Document:
- Where specific types of waste are produced (cardboard, wood, construction debris, compost)
- How much is generated at each location (rough estimates or data from prior audits)
- How that waste travels from production to container (routes, carts, staff)
This is often an eye-opener: Sometimes the biggest bins are nowhere near the highest waste-producing stations, and unmonitored areas breed inefficiency. Draw a simple flowchart or use mapping tools to visualize these journey points.
Step 3: Log Transport and Internal Workflows
This is where workflow efficiency really comes into focus. Ask:
- How far does each waste stream travel before reaching a compactor or container?
- Are there delays or bottlenecks (e.g., overfull bins causing overflow, requiring cleanup)?
- How frequently are containers filled, emptied, or compacted?
Some operations find that half their waste-handling time is spent moving materials unnecessarily! Opportunities for improvement often include reorganizing bin locations, providing more segregated containers closer to the source, or scheduling compaction at optimal intervals.
Step 4: Analyze Container Usage & Compaction Opportunities
Now, zoom in on your containers and ask:
- Are containers filling to capacity before each pickup, both by volume and by permitted weight?
- Is there unused space because materials are loosely packed?
- Could scheduled or on-demand mobile compaction (like that offered by BinMasters Québec) reduce pickups, container counts, or overflow incidents?
Waste journey mapping often reveals massive potential here. For example, it’s common for recycling bins to fill with air pockets, triggering early, and costly, pickups. By integrating mobile compaction at this stage, businesses regularly see a 40–70% volume reduction, meaning fewer hauls, less landfill cost, and a direct win for both environment and budget.
Step 5: Gather Data and Benchmark Results
It's essential to move from perception to reality. Collect:
- Pre- and post-compaction volumes (literal cubic metres saved)
- Frequency and cost per container rotation/pickup (before and after compaction)
- Labour hours spent on waste handling and container movement
- Feedback from staff, were pain points eliminated?
Analyzing this data will pinpoint quickly where your process improvements brought savings, and where further changes (or different compaction schedules/material handling) can make even bigger impacts. Tracking before-and-after stats turns your journey mapping into a repeatable optimization playbook.
Step 6: Embed Process Improvement & Continuous Monitoring
Waste journey mapping isn’t a one-and-done project. Make it a living, breathing part of your operational rhythm:
- Schedule recurring workflow reviews, especially after operational changes or busy cycles
- Empower team members to suggest tweaks (sometimes moving a bin five metres saves hours per month!)
- Track key performance indicators: cost per tonne, collection frequency, compactor ROI, and carbon reduction
If available, deploy digital tools or dashboards to monitor waste streams and container fill rates in real time for rapid response and ongoing workflow efficiency. This closes the loop on process optimization and keeps savings compounding.
Special Considerations: Quebec’s Unique Waste Landscape
Whether your waste journey map covers Montreal, the Laurentians, the South Shore, or Quebec City, there are a few special local considerations for maximizing value:
- Diverse Waste Streams: From building materials to compost and industrial scrap, ensure your mapping reflects all types and their specific collection/compaction needs.
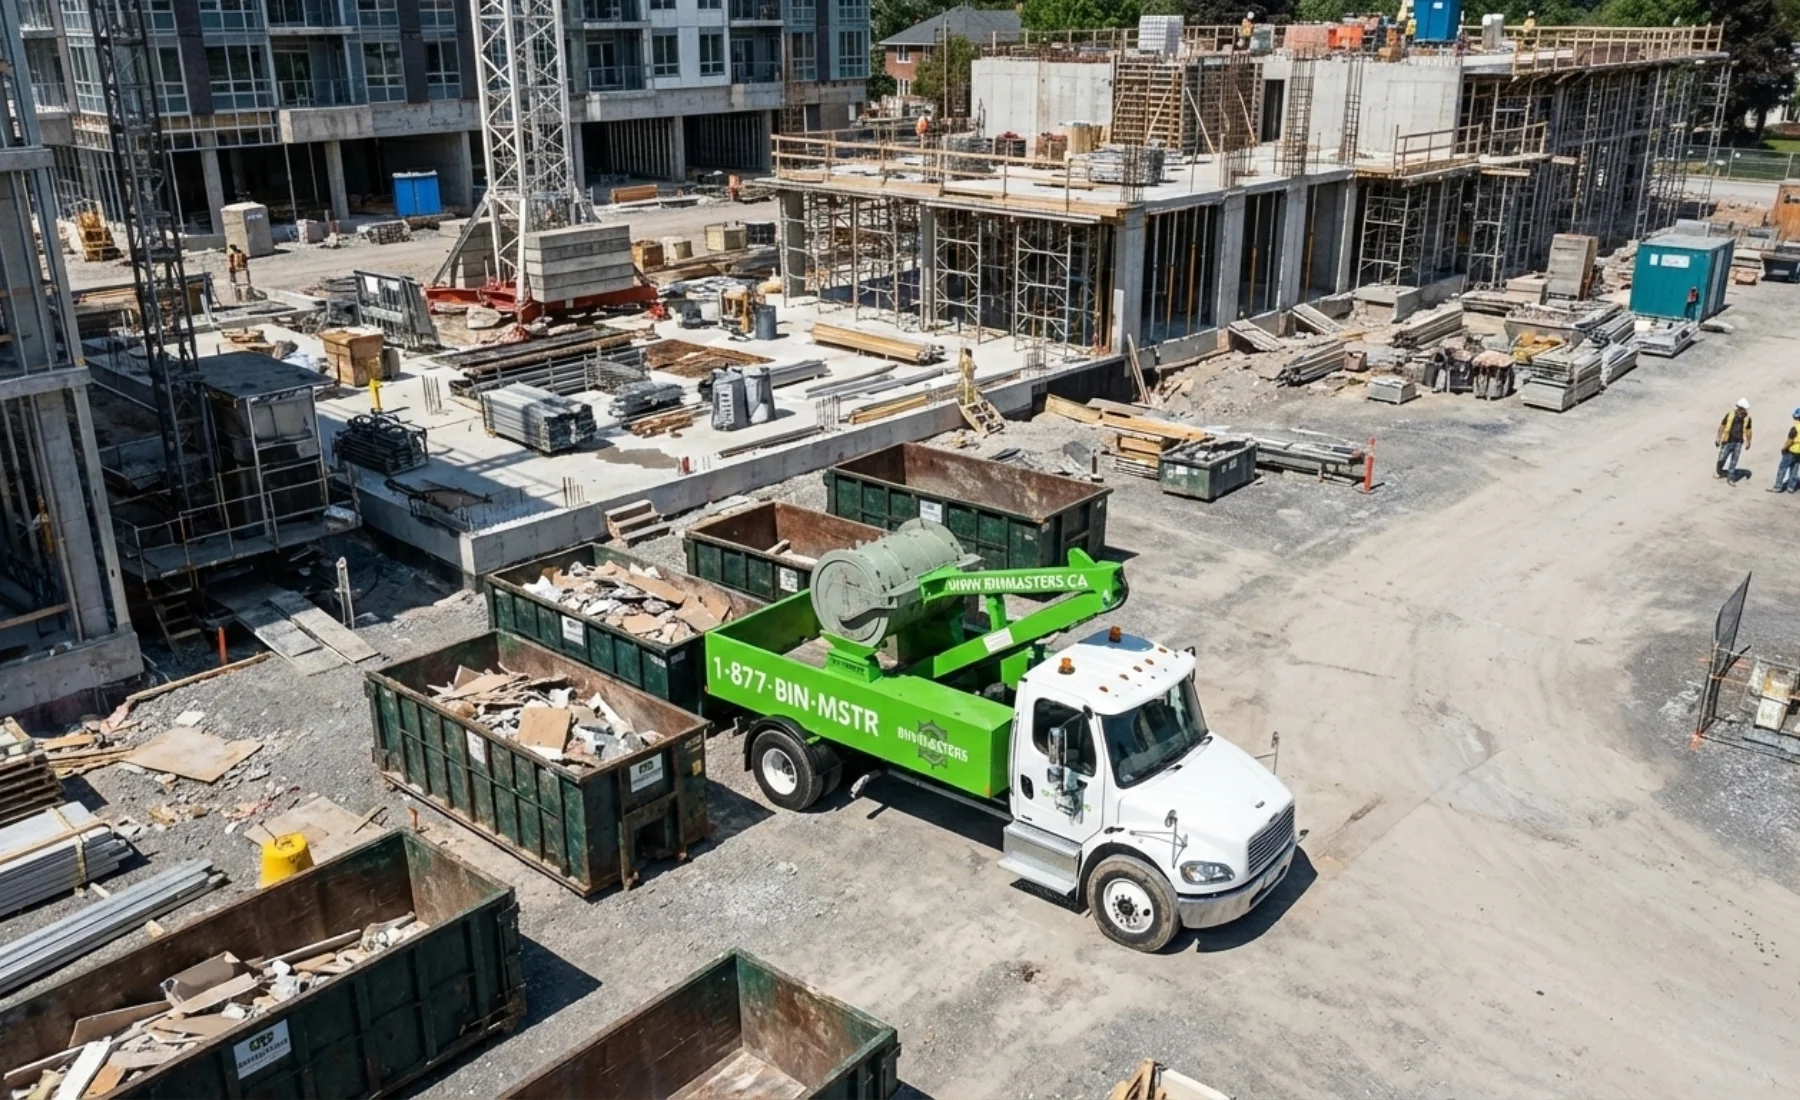
- Remote or Multi-Site Locations: Mobile compaction services can serve multiple facilities or large construction sites far from central dumps, delivering unified process improvement.
- Language & Compliance: Ensure process documentation and team training are presented in French and English for broadest impact and regulatory alignment.
How BinMasters Québec Makes Waste Journey Mapping Practical
Here at BinMasters Québec, our team has guided countless organizations across industries in mapping their waste journey, the results are clear:
- Compaction can reduce waste volume in containers by an average of 60%, with some streams seeing up to 75% savings.
- Service is fast (often under 10 minutes per compaction), safe, and risk-free for both containers and staff.
- There’s no need for costly equipment investments, our mobile solution fits directly into your mapped workflow and scales to your needs, without long-term commitments.
If you’re ready to visualize your waste journey and introduce high-impact workflow optimization, start with a free compaction consultation from BinMasters Québec. Let us show you just how much time, money, and space you can save on site, while driving meaningful environmental progress.
Conclusion: Let Your Waste Journey Map Guide Process Optimization
In today’s economic and environmental climate, streamlining your waste journey is a strategic imperative, not just another compliance box to tick. By mapping each step from waste creation to on-site compaction and acting on those insights, organizations unlock persistent savings, measurable process improvement, and a more sustainable future.
If you have questions about mapping your own waste workflow or want to see on-demand compaction in action, reach out to BinMasters Québec today. Together, we’ll make your waste journey a model of efficiency, responsibility, and cost control, one step at a time!